

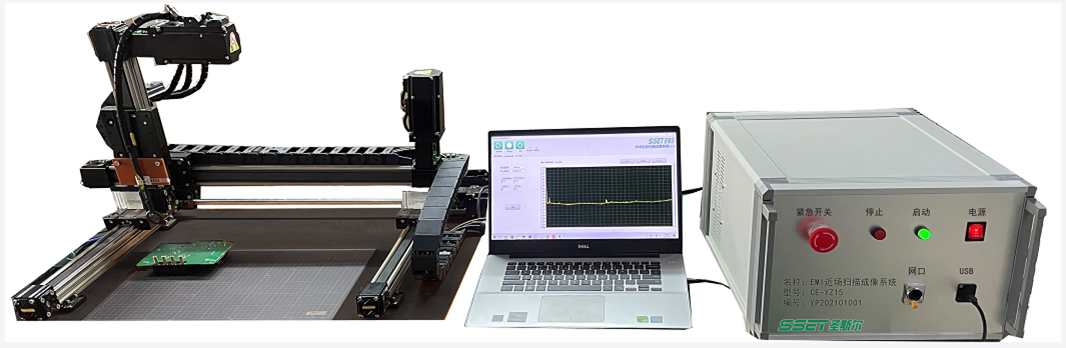
Electromagnetic Interference Intelligent Detector
HOME > PRODUCT > New Product
Background: With the rapid development of electronic technology, with the emphasis on external radiated interference (EMI) of electronic products, railways, electric power and other industries have clearly proposed technical standards and required mandatory implementation.
Purpose: Used for EMI interference analysis of electronic products and important devices. It can quickly and accurately locate the interference source and radiation path; analyze the intensity distribution; compare and analyze the problem product before and after improvement.
Purpose: This equipment effectively provides a practical means of EMI quantitative analysis. It is a powerful tool for analysis, improvement, compliance and quality in product development, which greatly improves development efficiency.
Measuring object | Equipment surface, PCB circuit board, integrated circuit, module, component |
Measuring method | Use a three-axis shift stage for electromagnetic scanning. |
Measurement type | Fixed-point broadband scanning, fixed-frequency planar scanning. |
Frequency Range | 9k~3.2GHz (expandable) |
Measuring range | 400×400mm (expandable), ±90 degrees |
Action step | 0.1mm |
Control interface | USB interface |
Power supply | AC220V |
Dimensions | 500×500mm |
Weight | 15kg |
CE-YZ15


System function
Function module | Function name | Function brief |
Automatic device connection | Automatic device connection | One-click connection to automatic scanning devices, spectrum analyzers and other equipment |
Broadband scanning | Scan frequency setting | Scan frequency range setting |
Scanning device settings | Move step, scan speed, scan range setting | |
Automatically find problem frequency | Scan the problem product in a wide range of frequencies to find the problem frequency | |
Automatically generate data list | Display ten frequency points and frequencies with the largest amplitude for easy analysis of the problem frequency | |
Single frequency scanning imaging | Center frequency, bandwidth setting | Set the center frequency to the problem frequency |
Scanning device settings | Move step, scan speed, scan range setting | |
Display real-time spectrum | Real-time display of the collected spectrum during the acquisition process | |
Scan and draw color temperature map | Scan the problem product and draw the color temperature map of the amplitude distribution | |
Spectrum automatic synthesis | View the frequency spectrum at each actual location of the problem product in the color temperature map | |
Problem location | After finding an abnormality in the color temperature chart, click the coordinates of the abnormal position to display its corresponding actual position | |
Other functions | Data storage comparison | Store the data and compare the two test results |
Automatically return to the origin | After scanning, the robotic arm automatically returns to the initi palosition |


